Memory Dumps
I’ve been looking at memory dumps often lately. Since I usually (always) debug with ‘printf’, I needed a better visual for my memory dumps. I decided to do a simple memory dumper:
And added some features:
- Colored output
- Different data types (hex, decimal, …)
- You can specify different regions with different colors and sub-regions
- Print actual data values
- Array elements alternate between bold and normal styles
- Display cache alignment
Here is a example:
// Example struct
struct S {
vec3 v;
point2 p;
};
// Array of S elements
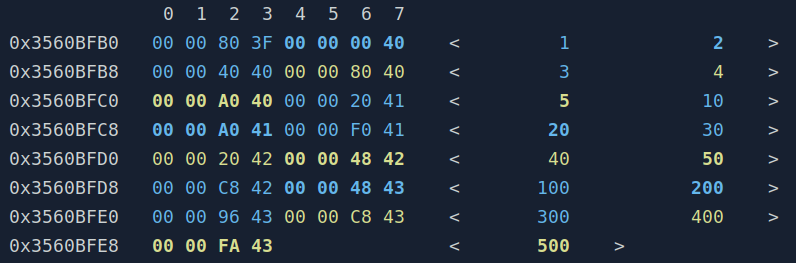
S v[3] = {{{1, 2, 3}, {4, 5}},
{{10, 20, 30}, {40, 50}},
{{100, 200, 300}, {400, 500}}};
// Here we can define a different region for each struct field:
auto layout = MemoryDumper::RegionLayout().withSizeOf<S>(3)
.withSubRegion(vec3::memoryDumpLayout().withColor(ConsoleColors::blue))
.withSubRegion(point2::memoryDumpLayout().withColor(ConsoleColors::yellow));
// Dump to console with colors and data values
MemoryDumper::dump(v, 3, 8, layout,
memory_dumper_options::type_values |
memory_dumper_options::colored_output);
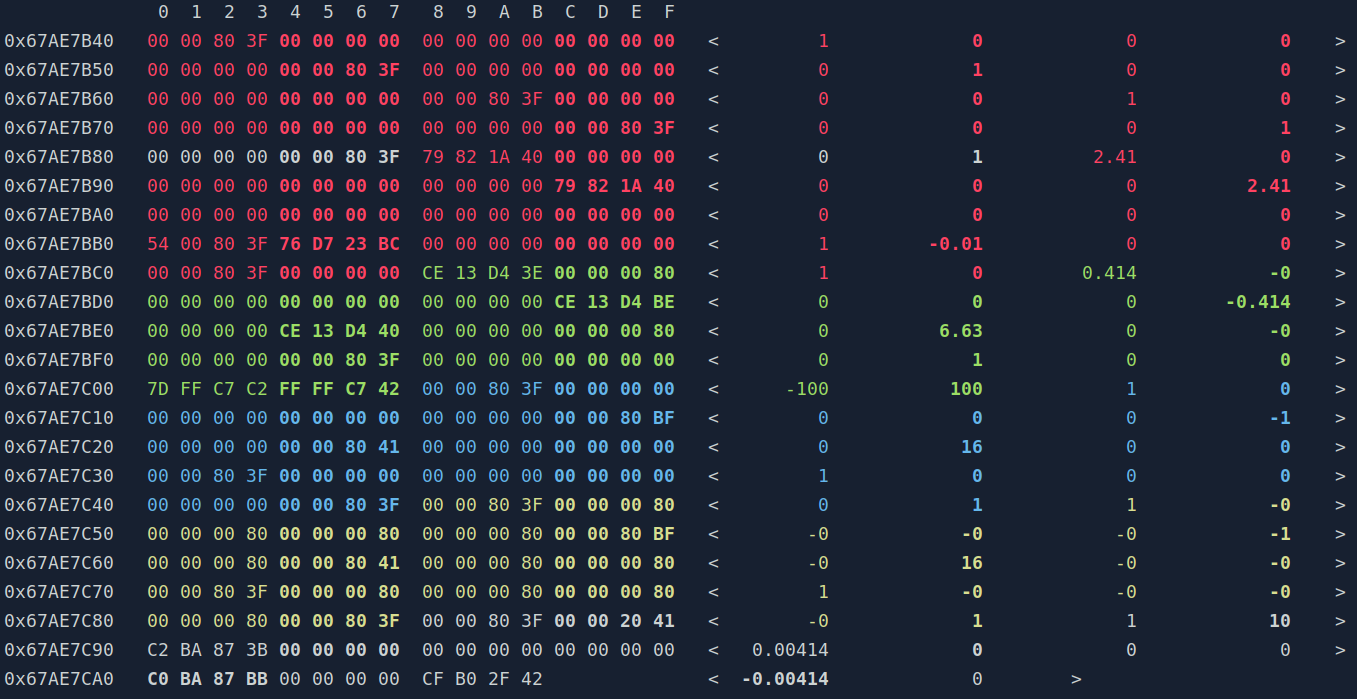
The example above produces the following result:
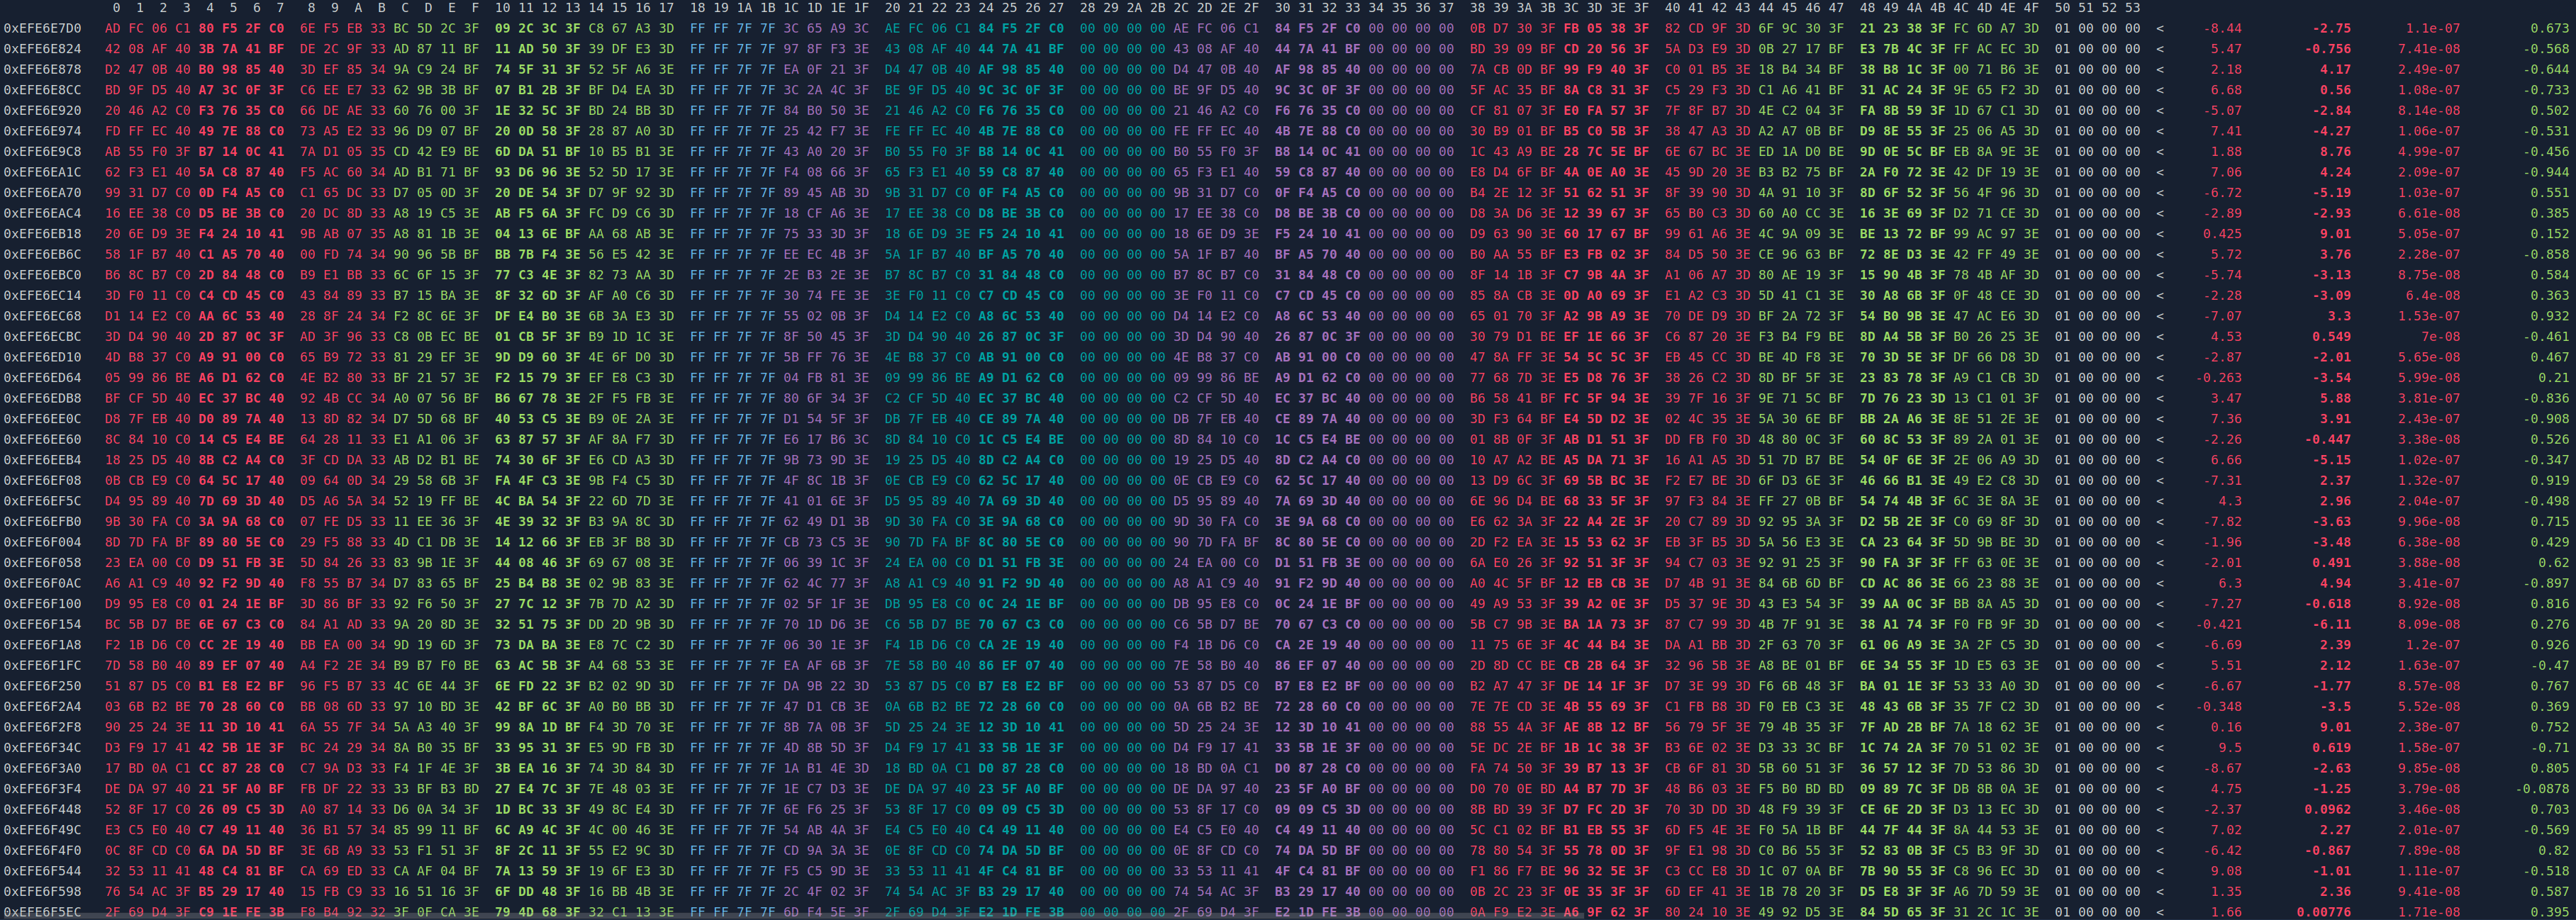
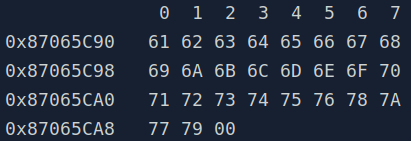
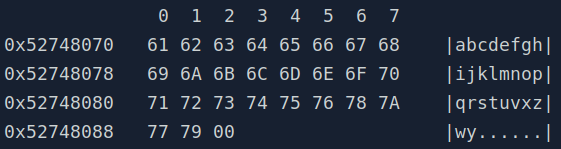
Here are some other examples:
- ascii
- matrices
- just too much…